Guides · Ocean layers
Sea temperature and ocean fronts
Read sea surface temperature, look below the surface with temperature at depth, and find fronts where warm water meets cooler water.
· 2 min read · By FishMap team
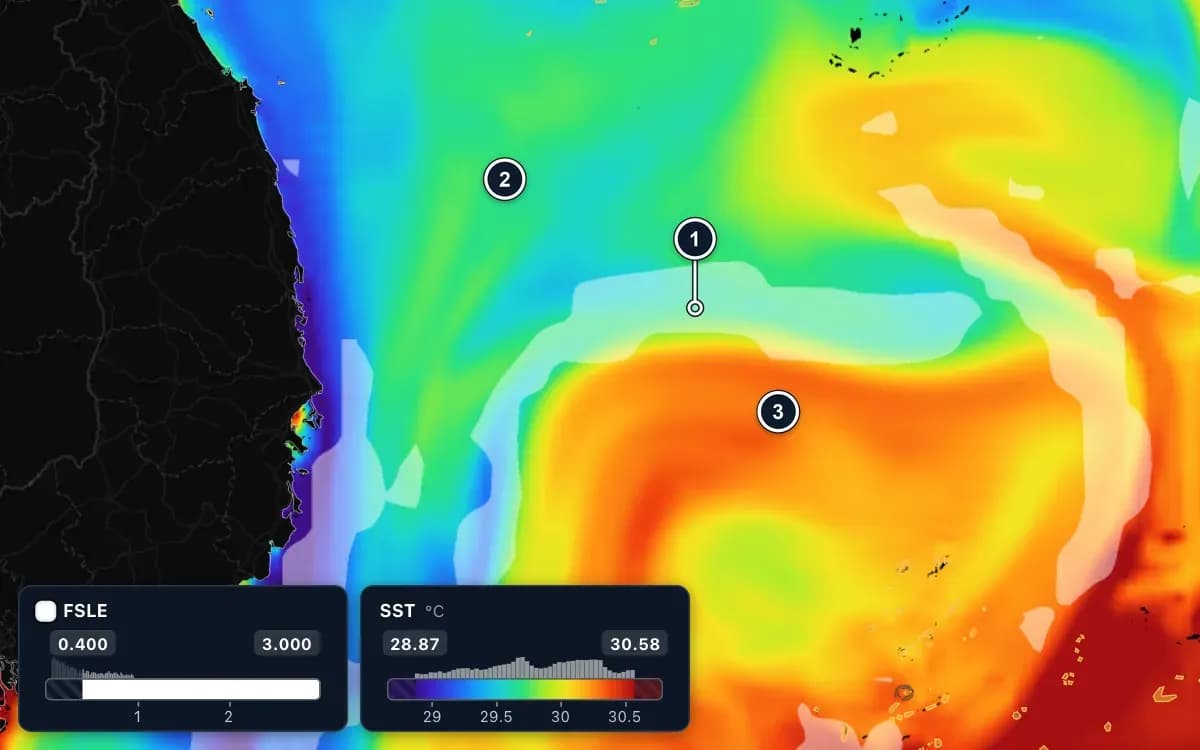
Fish follow water temperature. Each species has a range it prefers, and many gather where warm water meets cooler water. FishMap shows temperature at the surface and below it, and helps you find these boundaries, called fronts.
Sea surface temperature
Turn on Water temperature in the Ocean panel; it is part of the Default preset. At the surface the row reads SST. The legend runs from cold to warm: purple and blue are colder, yellow and red warmer.
By default the colour scale is A – Auto: the colours stretch over the water on screen, so even a small difference shows as a clearly different colour. That is good for spotting boundaries, but the same colour can mean a different temperature somewhere else. Click A/M on the legend and choose M – Manual to keep the colours fixed when you compare days. Hover over the sea to read the exact value.
Below the surface
Many fish feed below the surface. Use the Depth box at the top of the Ocean panel to choose a level, down to about 186 m; the row then reads SWT with the depth. The Mid-water 60 m (SWT) preset shows the water at 60 m in one click, and the Temperature by depth chart under the layer list shows the profile at the point under the cursor.
Thermal fronts
A thermal front is where the colour changes quickly over a short distance: warm water meets cold water. Bait and fish often gather along it.
- Look for tongues of cold water reaching into warm water: water rising from below, rich in food.
- The Thermal front preset highlights these edges. In summer, when the whole sea is nearly one colour, use Summer thermal front (contrast boost).
Current fronts (FSLE)
The FSLE layer draws thin lines where currents pull neighbouring water apart: the boundaries between bodies of water. Look at the lines; there is no need to read the numbers. A blue background is weak; bright, long yellow and orange lines are strong fronts.
The best bet is where an FSLE line lies on a warm–cold boundary. Show water temperature as colour and add the FSLE layer as FootPrint on its high values: the white bands that cross the colour change are worth trying first. A high fish habitat score right next to an FSLE line is more convincing too.
Which fish like what
Tuna and squid like warm offshore water; coastal small pelagics like it cooler. The species articles in the in-app Guide list the temperature range each one scores. Water temperature has forecasts for the next 7 days, so you can drag the timeline to see how a front may shift before you leave.
Fronts move from day to day. Use them as a guide to where to look, compare two or three days in a row, and always follow official weather bulletins.
More guides
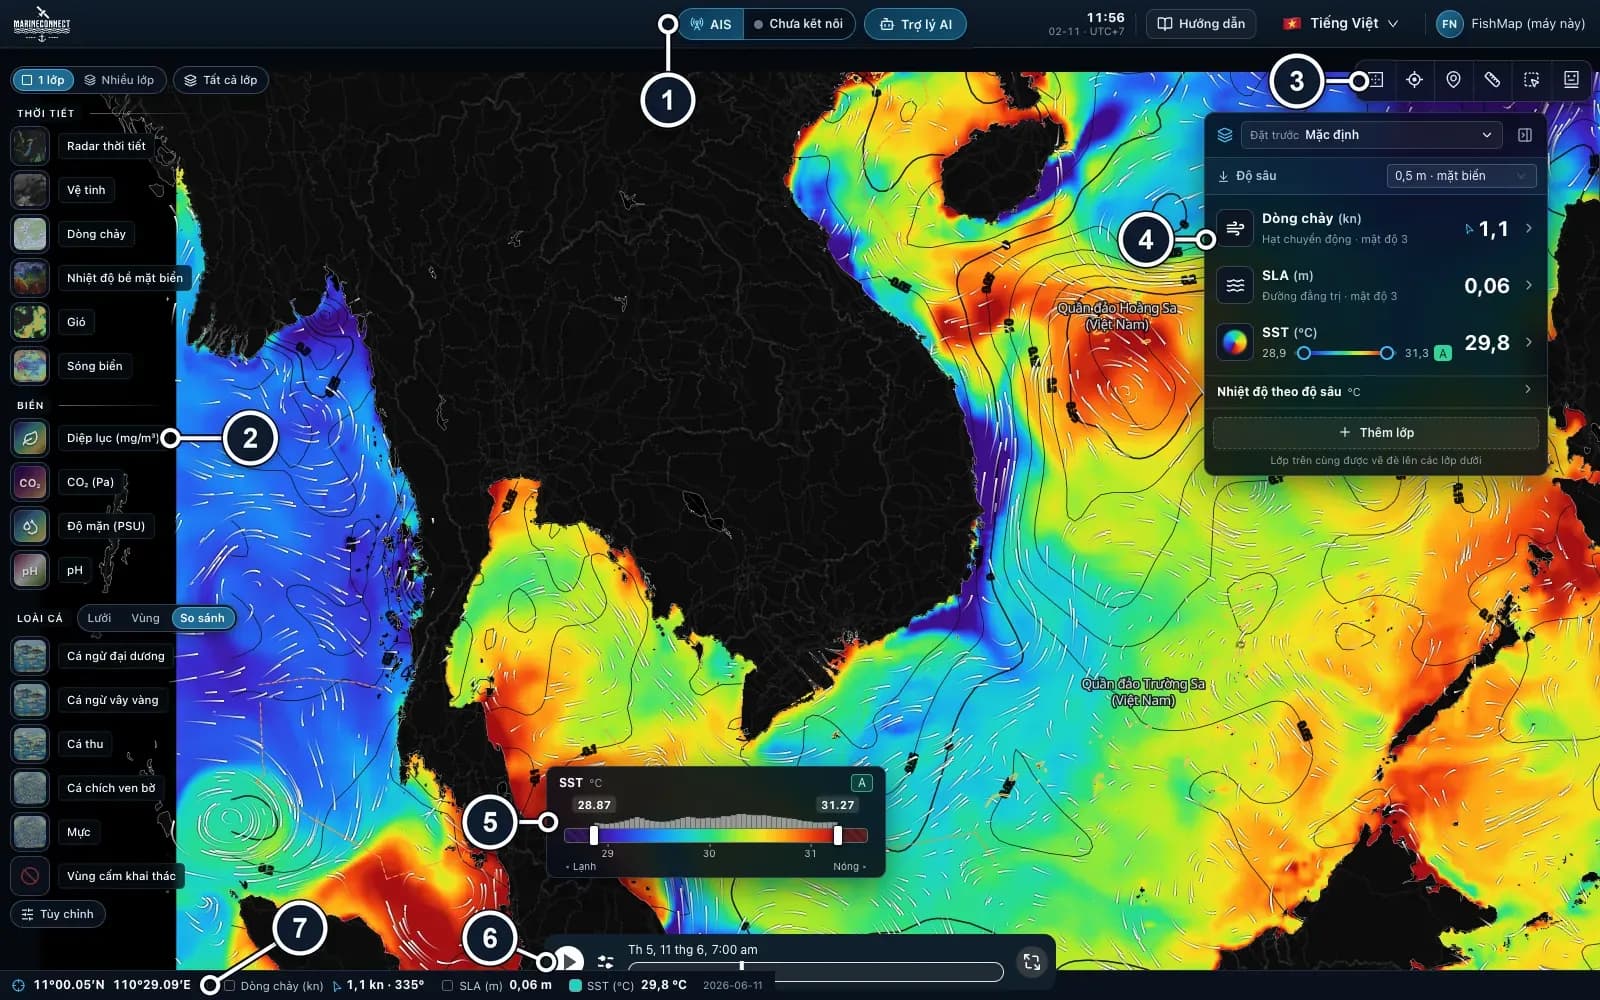 Guides · Getting started
· 3 min read
Getting started with FishMap
Download the desktop app, sign in and your 30-day free trial starts. Then take a first look at the screen and plan your first trip.
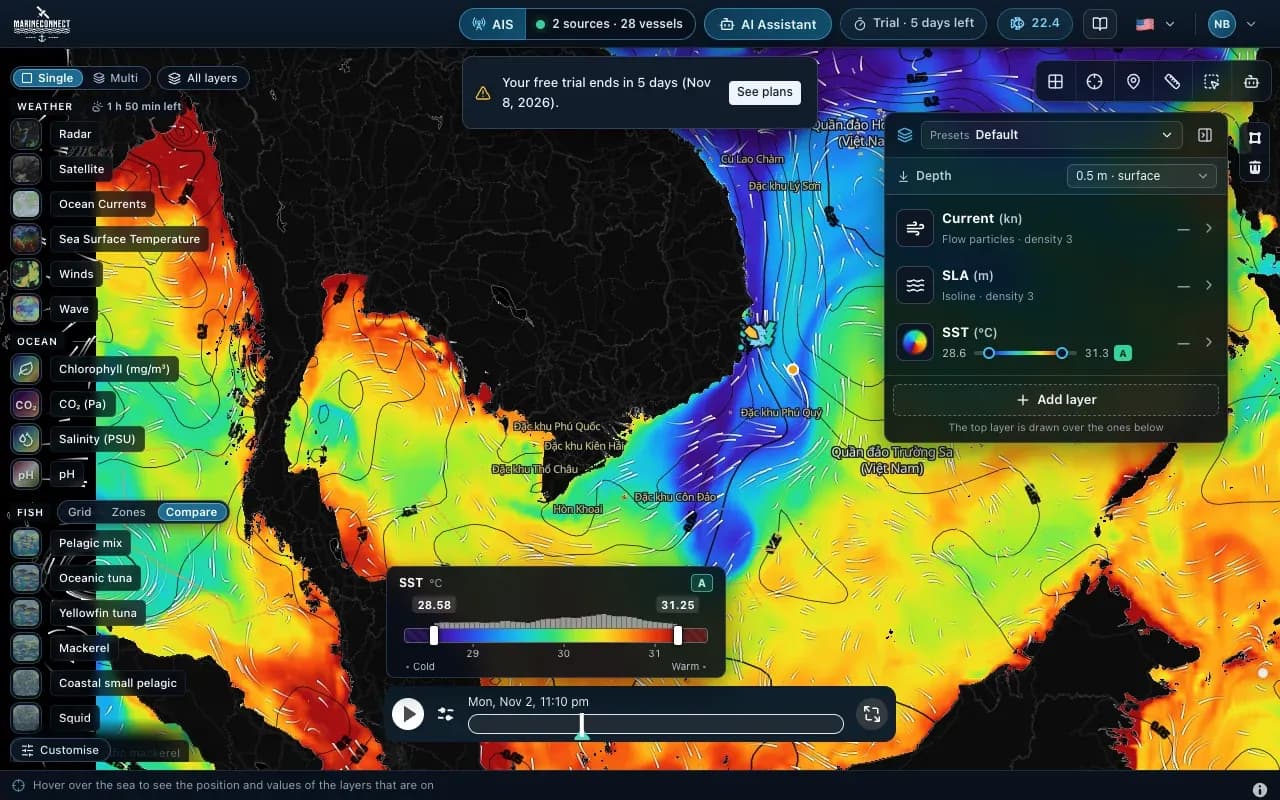 Guides · Getting started
· 2 min read
Installing FishMap on macOS
Drag the app into Applications, clear the macOS block with one Terminal command if needed, and answer the Keychain prompt once.
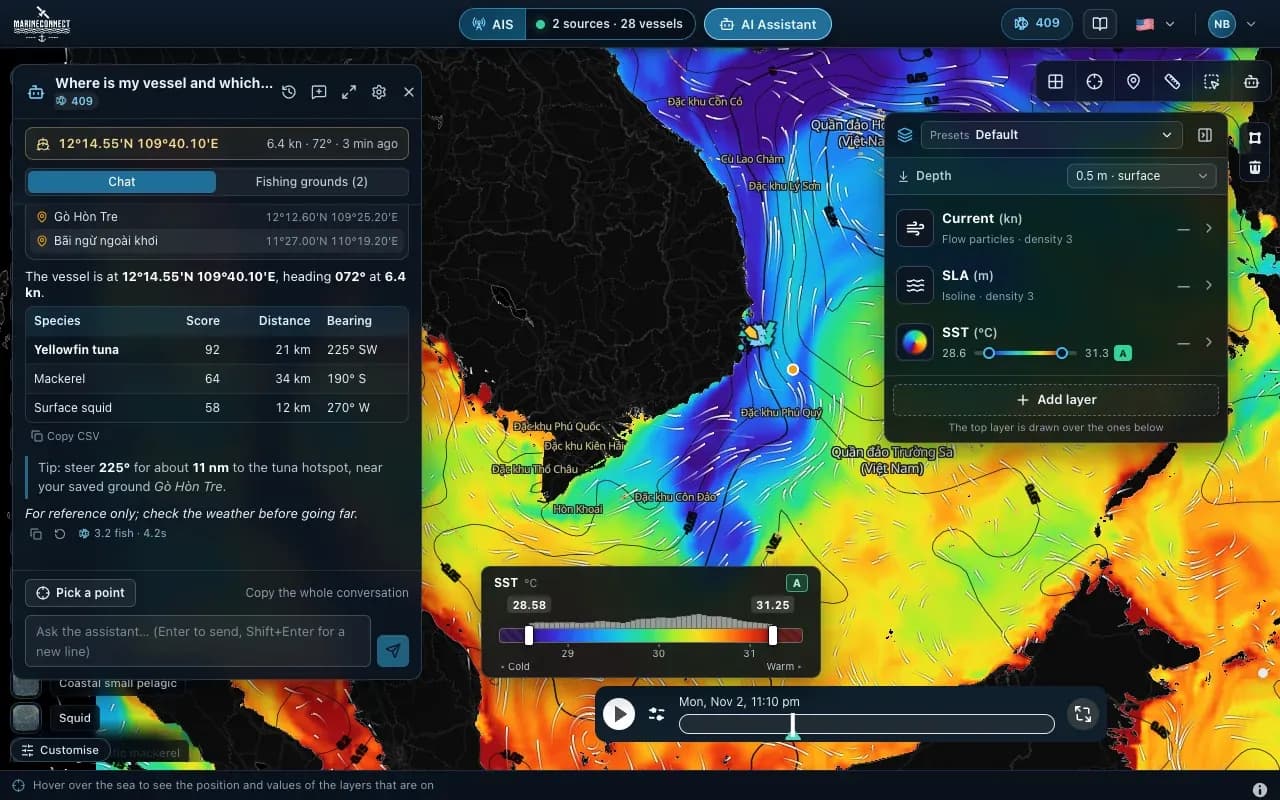 Guides · AI Captain
· 3 min read
How to ask the AI Captain
How to ask good questions, what an answer costs in fish, how to ask about one exact point, and how to save your fishing grounds.