Features
Everything FishMap shows you, and how to read it
FishMap brings the ocean, the fish and the weather onto one chart. Each section below explains a layer or a tool, with an example from Vietnamese waters and what to look for.
Jump to
Layers and tools
Currents
Speed, direction, flow particles
Waves
Height, direction, period
Sea temperature
At the surface and below
Ocean fronts
Where water masses meet
Chlorophyll
Food-rich green water
Salinity
River water and its edges
Sea level and eddies
Warm and cold eddies
Depth
Shelf edges, banks, reefs
Fish habitat
9 species, scored daily
Live weather
Radar, wind, storms
AI Captain
Questions in plain words
Offline at sea
Trip download, AIS, spot book
Currents
See where the water runs, meets and turns
Included inEvery plan
Colour shows the current speed in knots; white particles drift the way the water moves. Coastal currents, meeting zones and eddies stand out at a glance.
- 7-day forecast: drag the timeline to see tomorrow’s flow
- Stack it over temperature or sea level to find edges
What to look for
- 1. Strong current along the coast (red, orange) flowing south: the white streaks move fastest here.
- 2. Where currents meet: offshore water flows in and joins the coastal current. Meeting zones like this often gather bait and fish.
- 3. Eddy: the white streaks circle around calm water (dark blue). Fish often follow the edge of an eddy.

Waves
Wave height, direction and period, a week ahead
Included inEvery plan
The Waves layer shows how high the sea is, the direction waves come from and how long between crests, in every plan. Check it against your boat’s limits before you commit to a long run.
Read the wave layer news- Wave height in metres, with the direction waves come from
- Wave period: long swells and short, steep seas look different
- 7-day forecast on the same timeline as currents and temperature
- The in-app guide explains danger levels for small boats
Sea temperature
Find the warm and cool water your species likes
Included inEvery plan
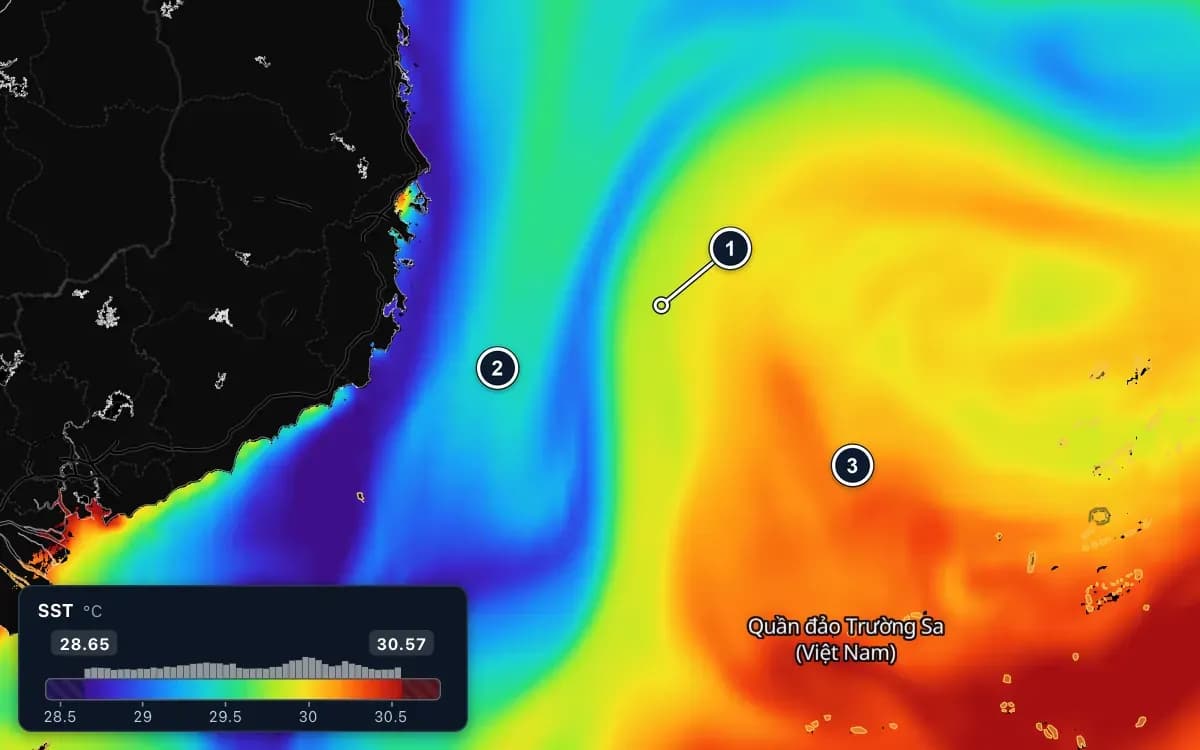
Sea surface temperature comes with every plan. The automatic colour scale stretches over the water on screen, so even half a degree shows as a clear change. Fishing Ground adds temperature below the surface, level by level.
What to look for
- 1. Thermal front: the colour changes quickly over a short distance, where warm water meets cold water. Fish often gather along this band.
- 2. Colder water (blue, purple) close to the coast.
- 3. Warmer water (orange, red) offshore.
Ocean fronts
Fronts: the lines where bait and fish gather
Included inFishing Ground plan
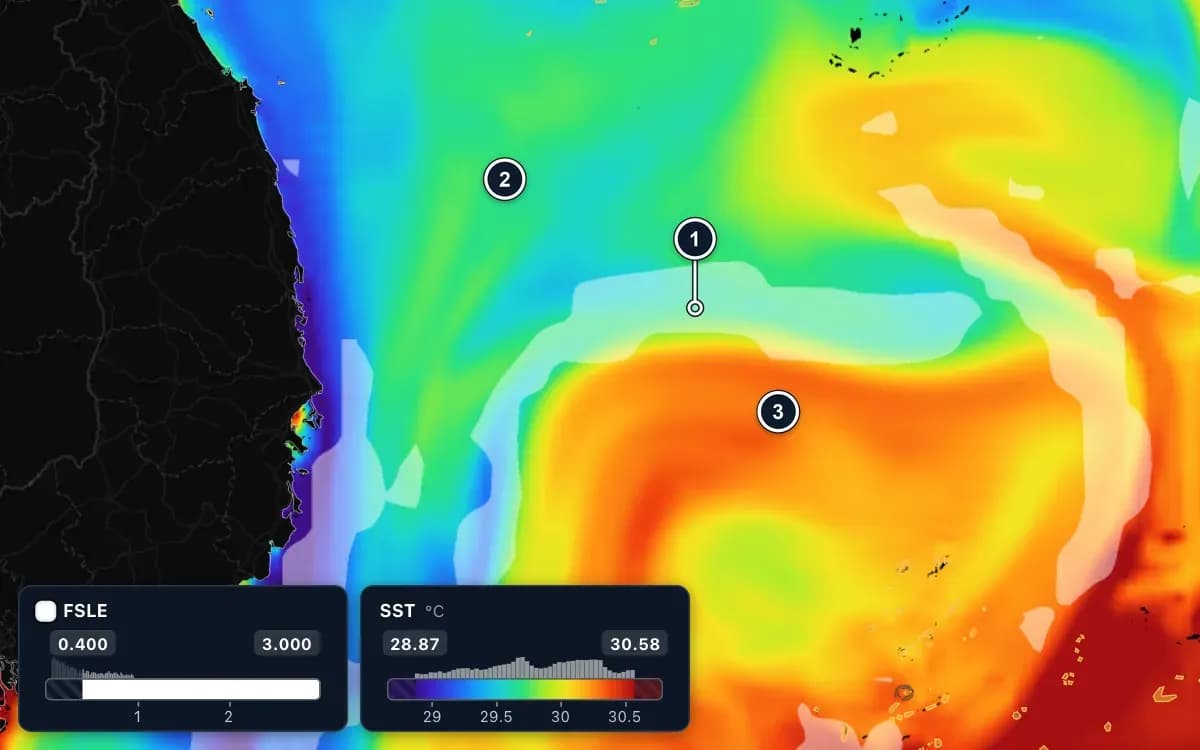
The fronts layer draws thin bright lines where bodies of water pull apart and meet. Laid over temperature, the place where a front crosses the warm–cold boundary is the best bet.
What to look for
- 1. Where the FSLE line (white band) meets the warm–cold boundary: the best bet.
- 2. Colder water (green, blue).
- 3. Warmer water (orange, red).
Chlorophyll
Green water feeds the food chain
Included inFishing Ground plan
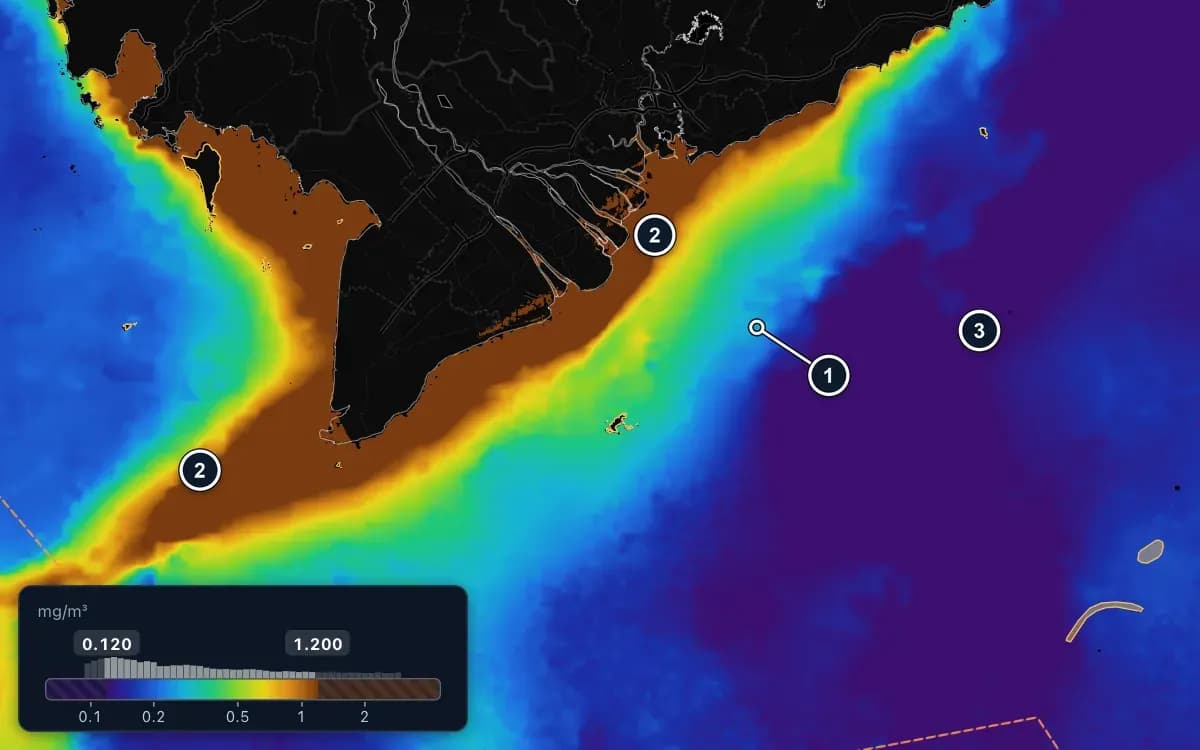
Chlorophyll shows where plankton grows. The edge between green, food-rich water and clear blue water is where larger fish often wait.
What to look for
- 1. The edge of green water, next to clear water: the colour changes quickly from green to blue and purple. Large fish wait here.
- 2. Coast and river mouths (brown): above 1 mg/m³, water rich in food. The current carries it along the coast and round the Cà Mau cape in a long band.
- 3. Clear water offshore (purple): about 0.1 mg/m³, poor in food.
Salinity
Follow river water out to sea
Included inFishing Ground plan
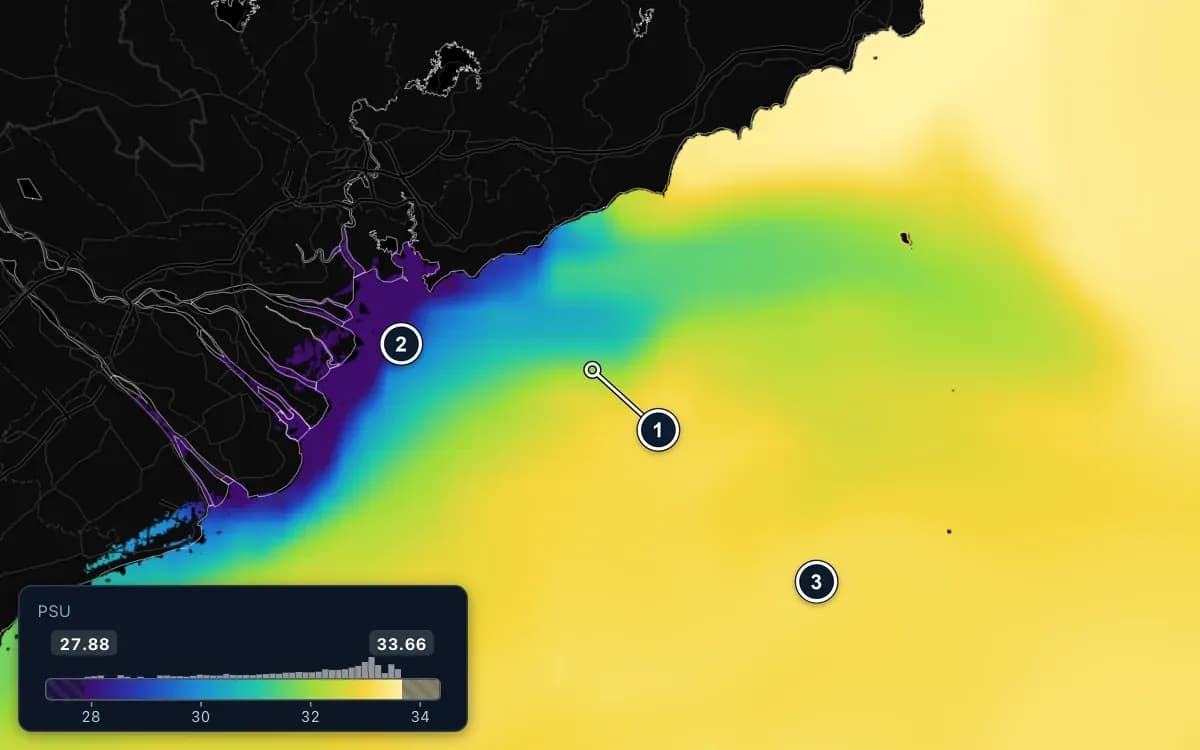
Fresher river water spreads over the salty sea in plumes. Their edges carry nutrients, and small pelagics gather along them.
What to look for
- 1. The edge of river water: where fresher water meets salty water and the colour changes quickly. Rich in nutrients; small pelagics gather there.
- 2. River water flowing out to sea (purple, blue): it makes the coastal water fresher, freshest right at the river mouths.
- 3. Salty offshore water (yellow): saltier and steadier.
Sea level and eddies
Warm and cold eddies, and the fast water between them
Included inFishing Ground plan
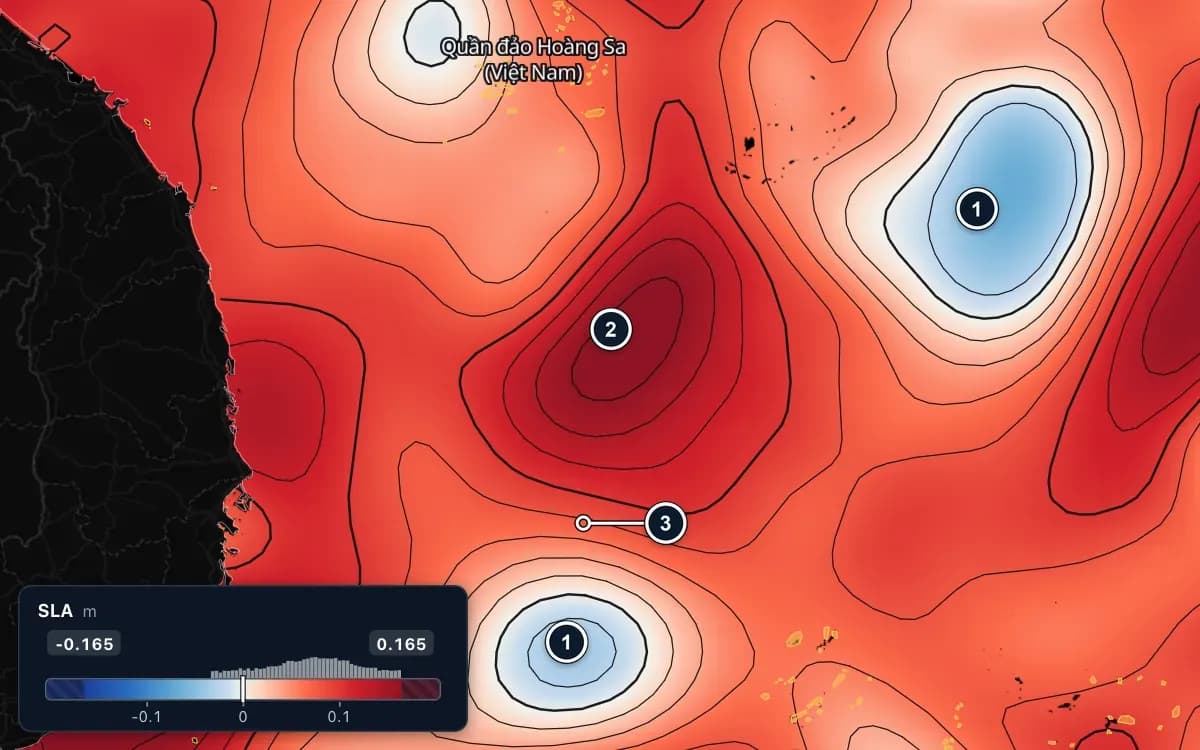
Sea surface height is in every plan. The sea level anomaly view in Fishing Ground shows where the surface sits above or below normal: cold eddies lift rich water, and the edges between eddies are worth a look.
What to look for
- 1. Cold eddy (blue): the sea surface is lower than normal; cold, food-rich water rises from below.
- 2. Warm eddy (dark red): the sea surface is higher than normal, over a thick layer of warm water.
- 3. The edge between the warm and the cold eddy: the black lines crowd together and the current runs faster. Fish often follow this band.
Depth
Shelf edges, banks and reefs
Included inEvery plan
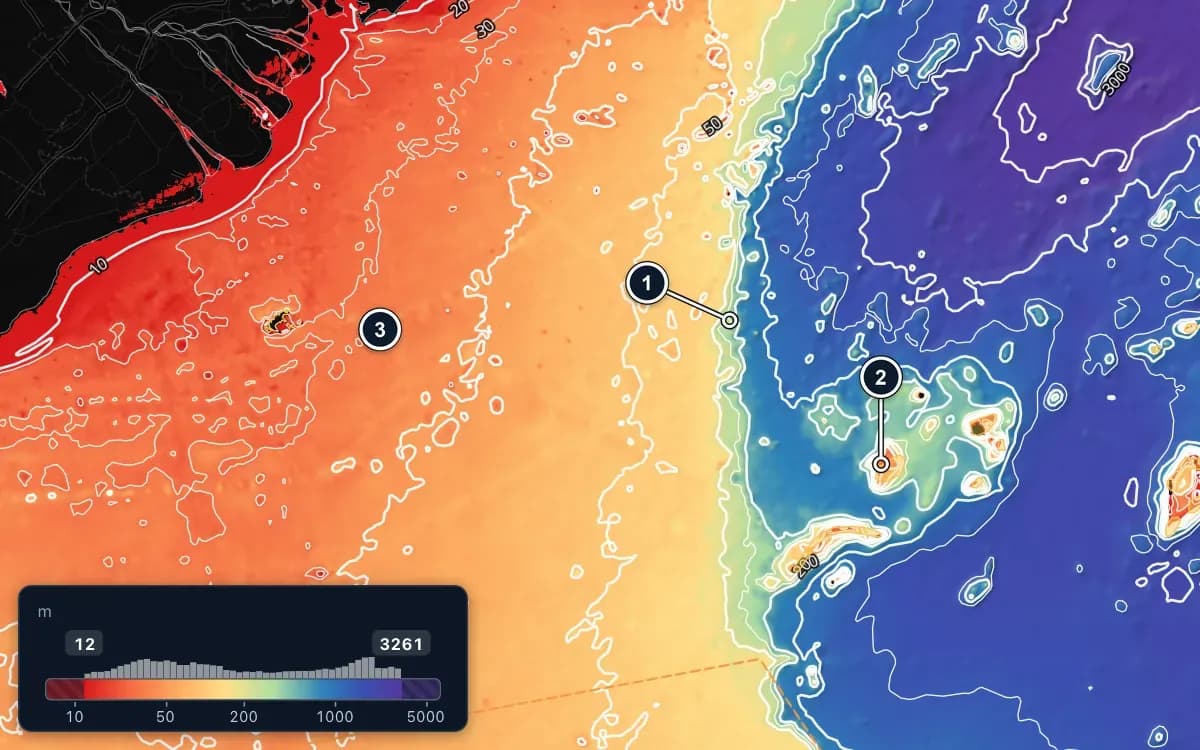
Depth colours, terrain shading and contour lines show where the bottom drops away. Currents turn at the shelf edge and bait gathers there.
What to look for
- 1. Shelf edge: the bottom drops away and the depth contours crowd together. Currents turn here and bait gathers.
- 2. Banks and reefs in deeper water: the bottom rises from more than 1,000 m (blue, purple) to about 40 m (orange, red).
- 3. Shallow shelf (red, orange): small pelagics and Indo-Pacific mackerel are scored here; tuna and squid only over deep water.
Fish habitat
A daily score for where each species should be
Included inFishing Ground plan
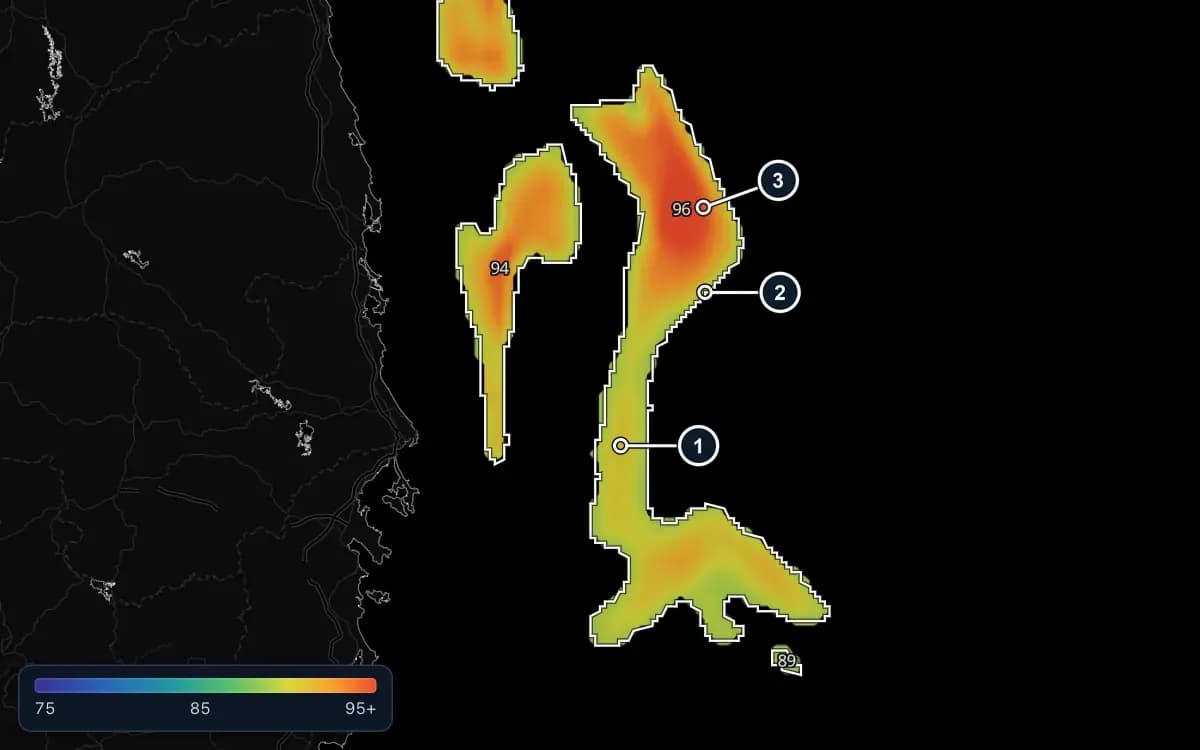
For 9 species, from yellowfin and oceanic tuna to mackerel, round scad and squid, FishMap scores the water each day from temperature, depth, currents, eddies, chlorophyll and season. Grid shows every cell, Zones outlines the best areas, Compare shows both with the score of each zone.
- Always check the weather, closures and the rules for your waters
What to look for
- 1. The grid underneath: each cell coloured by its own score. The tail of this zone is yellow and green, lower than its red core.
- 2. The white zone outline on top.
- 3. The zone's score: one number for the whole zone. To see the exact cell, hover over the grid: the number shows in the bottom bar.
Live weather
Radar, satellite, wind and storms on the same chart
Included inFishing Ground plan
Fishing Ground includes 60 hours of live weather every 30 days. Time only counts while a weather layer is on the map and you are using the app; it pauses on its own after 10 minutes without input.
- Radar and satellite cloud
- Wind and waves, with forecasts
- Tropical storms and their tracks
- Always follow official weather bulletins
AI Captain
Ask about your waters in plain words
Included inAI Captain and Fishing Ground
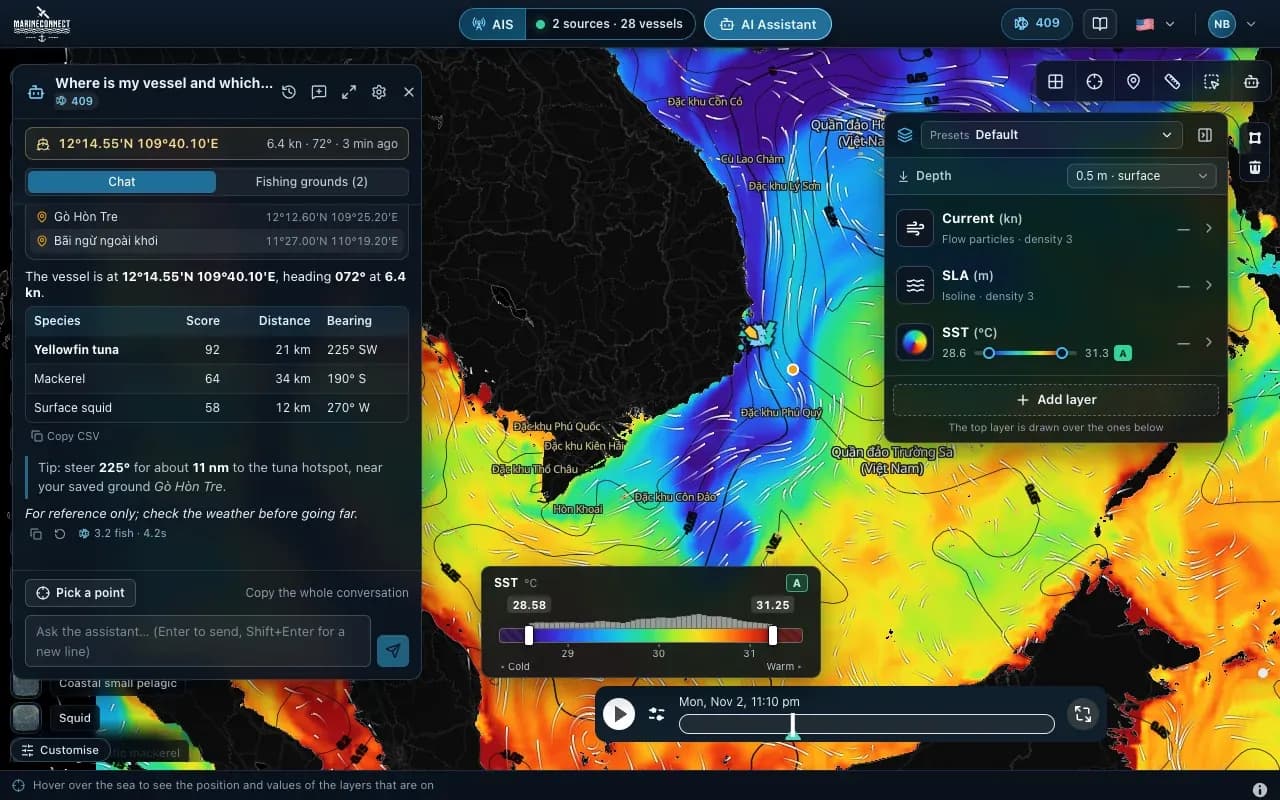
Pick a point on the map or name a saved ground and ask. The AI Captain reads FishMap’s sea and fish data and answers with distances, bearings and scores, in English, Vietnamese or Thai. Each answer uses a few fish from your plan.
- “Where is my vessel and which water nearby suits yellowfin tuna?”
- “Compare my saved grounds for tomorrow morning.”
- 300 fish every 30 days in AI Captain, 770 in Fishing Ground
- Answers are for reference: check the weather before going far
One screen
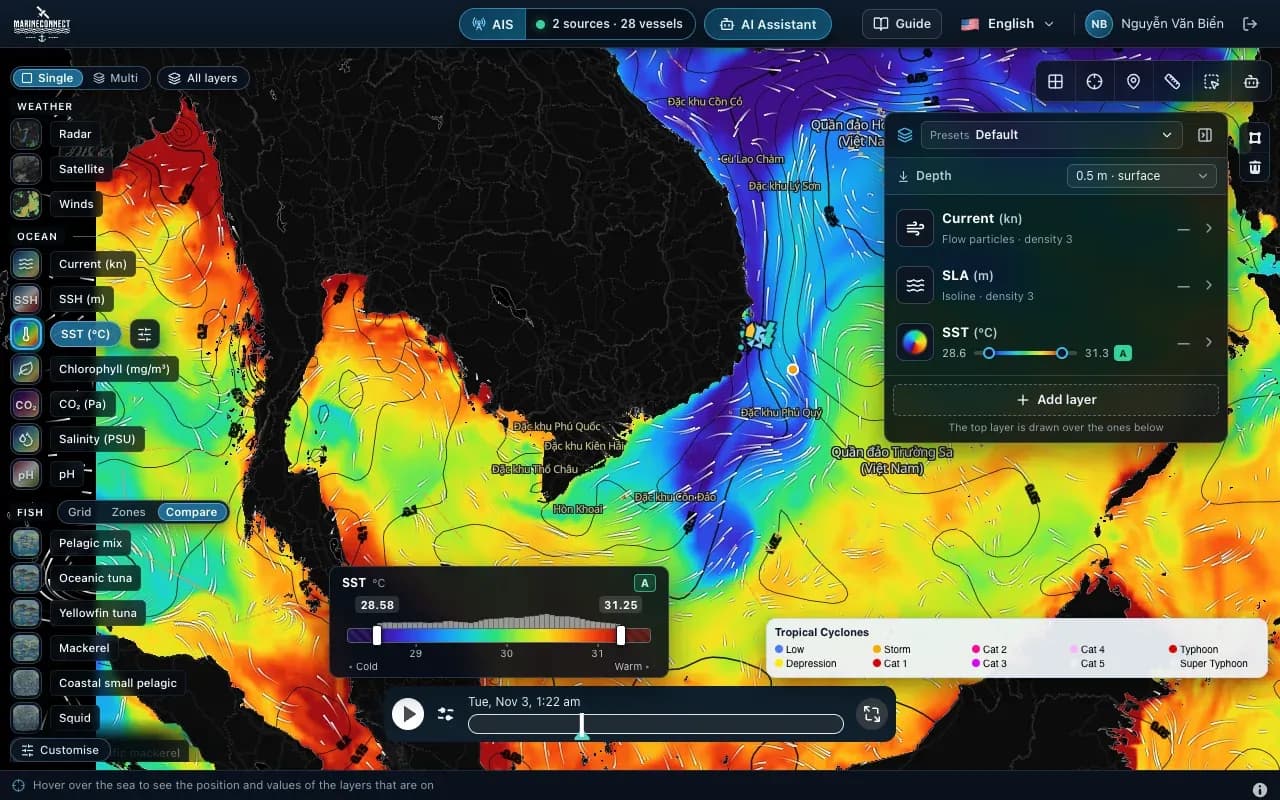
AIS, your spot book and every tool in one place
Included inEvery plan
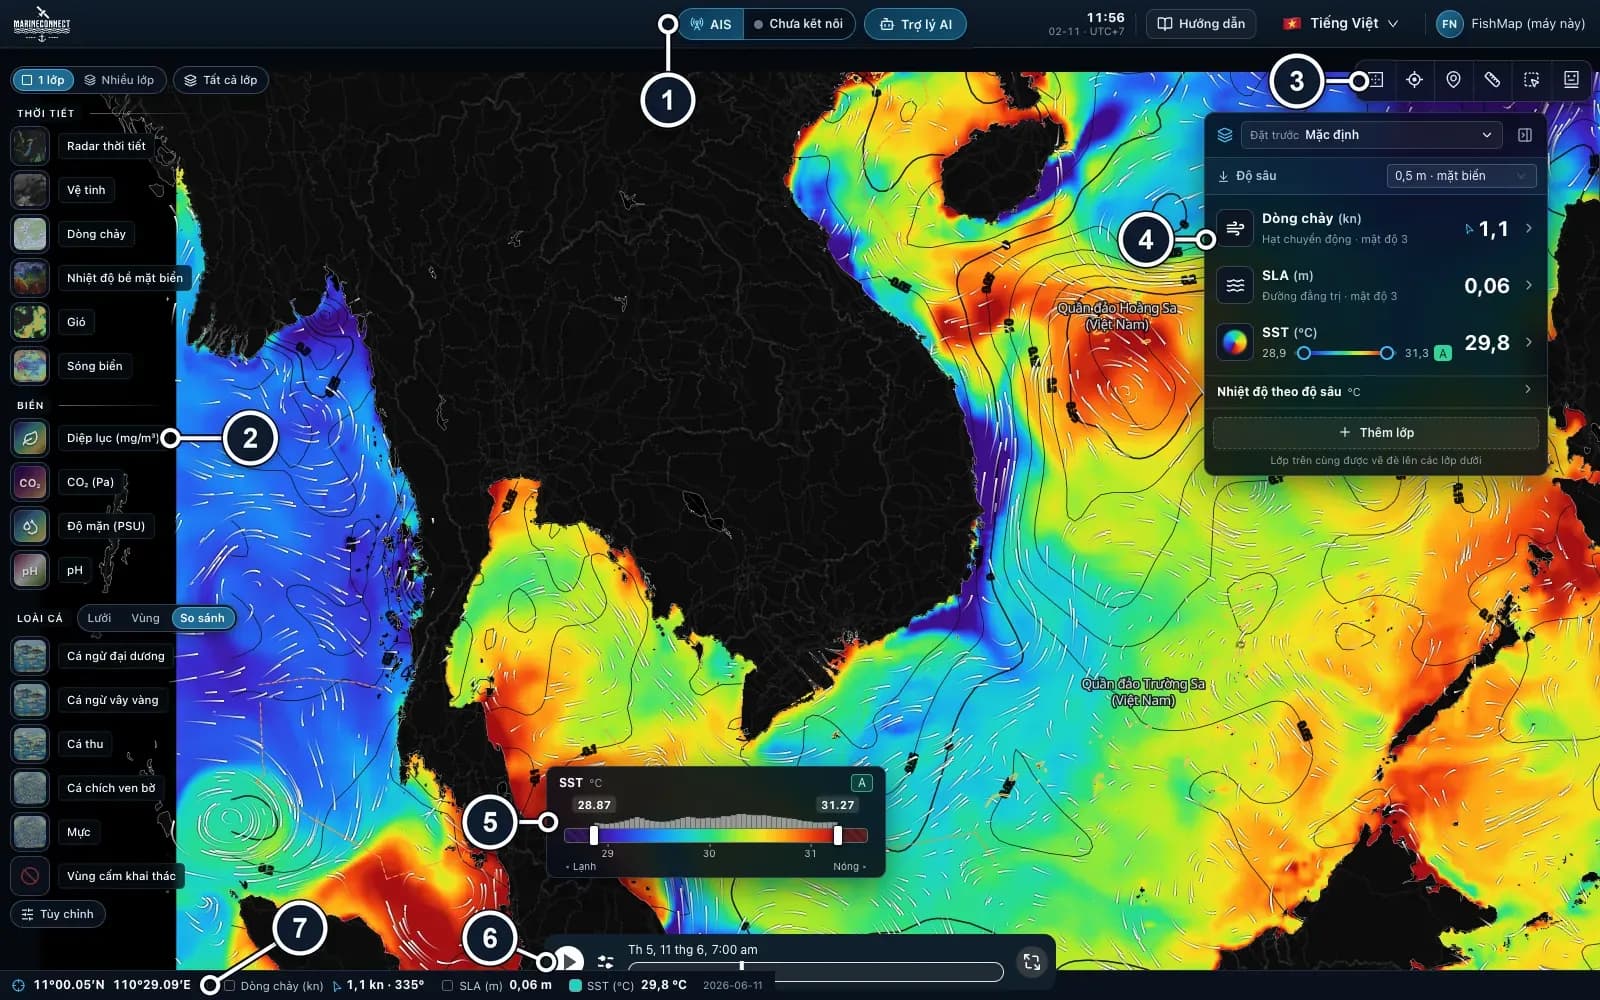
Connect your onboard AIS receiver to see nearby vessels, keep your own fishing spots and zones, measure distances and read the values under the cursor. Everything sits where a chart plotter user expects it.
What to look for
- 1. Top bar: AIS, AI Assistant, ship's clock, Guide, language, account.
- 2. Layer rail (left edge): the Weather, Ocean and Fish groups and Fishing closures. At the top: Single / Multi and All layers.
- 3. Map tools (top right): globe, data inspector, location, ruler, polygon, fishing zones.
- 4. Ocean panel (right): stack ocean layers and choose how they are drawn.
- 5. Colour legend of the layer that is on.
- 6. Timeline: drag it to see another day and time.
- 7. Status bar: the position and values under the cursor.
Offline at sea
Ready before you lose signal
Included inEvery plan
Before you leave, press “Download data for the trip”: FishMap stores the sea data for your area and days on your computer. Offshore, the base map built into the app, the layer rail, AIS and your spot book keep working without internet.
Guide: offline trip download- The base map is part of the app: it opens with no connection at all
- Download the days you will be at sea for your fishing area
- AIS from your own receiver works without internet
- Your spot book and saved zones stay on your computer
See it on your own waters
Every feature is open for 30 days when you first sign in. No card needed.